Performing Fuzzy Table Joins#
Introduction#
When merging data from different sources, one often needs to match records with slightly different spellings. Instead of an exact match, we can perform a Fuzzy match to find matching records from two diffent tables that have slight variations. Python ecosystem offers an excellent fuzzy matching package TheFuzz (formerly FuzzyWuzzy). We use this along with GeoPandas to do a fuzzy table join. The tutorial also covers advanced data-cleaning techniques required for working with messy real-world datasets.
Overview of the task#
We will be working with 2 data layers for the Sri Lanka. Given the shapefile of Admin4 regions and a CSV file containing division-wise population statistics - we will learn how to merge them to display these indicators on a map.
Input Layers:
lka_admbnda_adm4_slsd_20220816.shp: A shapefile of all Grama Niladhari (GN)Divisions (Admin Level 4) of Sri Lanka.GN_Division_Age_Group_of_Population.csv: Age-wise population for all GN Divisions of Sri Lanka.
Output:
srilanka.gpkg: A geopackage containing merged dataset.
Data Credit:
Sri Lanka Population Statistics: Department of Census and Statistics - Sri Lanka. Downloaded from DCS Map Portal](http://map.statistics.gov.lk/).
Sri Lanka - Subnational Administrative Boundaries: Sri Lanka administrative levels 0-4 shapefiles and gazetteer. Downloaded from HDX portal.
Setup and Data Download#
The following blocks of code will install the required packages and download the datasets to your Colab environment.
Running the Notebook:
The preferred way to run this notebook is on Google Colab.
![]()
%%capture
if 'google.colab' in str(get_ipython()):
    !pip install thefuzz
import os
import numpy as np
import pandas as pd
import geopandas as gpd
import matplotlib.pyplot as plt
from thefuzz import process
data_folder = 'data'
output_folder = 'output'

if not os.path.exists(data_folder):
    os.mkdir(data_folder)
if not os.path.exists(output_folder):
    os.mkdir(output_folder)
def download(url):
    filename = os.path.join(data_folder, os.path.basename(url))
    if not os.path.exists(filename):
        from urllib.request import urlretrieve
        local, _ = urlretrieve(url, filename)
        print('Downloaded ' + local)

data_url = 'https://github.com/spatialthoughts/geopython-tutorials/releases/download/data/'

shapefile = 'lka_admbnda_adm4_slsd_20220816'
exts = ['.shp', '.shx', '.dbf', '.prj']
csv_file = 'GN_Division_Age_Group_of_Population.csv'

for ext in exts:
  download(data_url + shapefile + ext)

download(data_url + csv_file)
Procedure#
Pre-Process Data Table#
The data table containing population couts is organized by 1 row per GN Division. We do not have a unique identifier that uniquely matches a GN Division. Since GN Division names are not unique amounf different provinces, we must create a unique identifier to be able to match it against another data source.
csv_path = os.path.join(data_folder, csv_file)
df = pd.read_csv(csv_path)
df.iloc[:, :5]
| GN Division | DS Division | District | Province | Total Population | |
|---|---|---|---|---|---|
| 0 | Sammanthranapura | Colombo | Colombo | Western | 7829 |
| 1 | Mattakkuliya | Colombo | Colombo | Western | 28003 |
| 2 | Modara | Colombo | Colombo | Western | 17757 |
| 3 | Madampitiya | Colombo | Colombo | Western | 12970 |
| 4 | Mahawatta | Colombo | Colombo | Western | 8809 |
| ... | ... | ... | ... | ... | ... |
| 13984 | Demeda | Deraniyagala | Kegalle | Sabaragamuwa | 971 |
| 13985 | Kosgahakanda | Deraniyagala | Kegalle | Sabaragamuwa | 2336 |
| 13986 | Yatiwala | Deraniyagala | Kegalle | Sabaragamuwa | 1882 |
| 13987 | Magala | Deraniyagala | Kegalle | Sabaragamuwa | 1076 |
| 13988 | Dikellakanda | Deraniyagala | Kegalle | Sabaragamuwa | 684 |
13989 rows × 5 columns
GN Division names are not unique, so they can’t be used as identifiers for a join.
df[df['GN Division'].duplicated(keep=False)].sort_values('GN Division').iloc[:, :5]
| GN Division | DS Division | District | Province | Total Population | |
|---|---|---|---|---|---|
| 8944 | Abakolawewa North | Ambanpola | Kurunegala | North Western | 561 |
| 6521 | Abakolawewa North | Weeraketiya | Hambantota | Southern | 648 |
| 8954 | Abakolawewa South | Ambanpola | Kurunegala | North Western | 488 |
| 6520 | Abakolawewa South | Weeraketiya | Hambantota | Southern | 322 |
| 6303 | Abhayapura | Lunugamvehera | Hambantota | Southern | 624 |
| ... | ... | ... | ... | ... | ... |
| 2375 | Yatiyana East | Agalawatta | Kalutara | Western | 1493 |
| 978 | Yatiyana East | Minuwangoda | Gampaha | Western | 2004 |
| 13634 | Yodhagama | Aranayaka | Kegalle | Sabaragamuwa | 760 |
| 13493 | Yodhagama | Rambukkana | Kegalle | Sabaragamuwa | 1421 |
| 13371 | Yodhagama | Embilipitiya | Ratnapura | Sabaragamuwa | 5657 |
2511 rows × 5 columns
Let’s create a unique idenfier by merging the Admin4, Admin3, Admin2 and Admin1 names. We also remove whitespaces and convert the names to lowercase to ensure the match is case insensitive.
df_processed = df.copy()
gn_division = df_processed['GN Division'].str.lower().str.replace(' ', '')
ds_division = df_processed['DS Division'].str.lower().str.replace(' ', '')
district = df_processed['District'].str.lower().str.replace(' ', '')
province = df_processed['Province'].str.lower().str.replace(' ', '')

df_processed['joinkey'] = gn_division + ds_division + district + province
df_processed[['GN Division', 'DS Division', 'District', 'Province', 'joinkey']]
| GN Division | DS Division | District | Province | joinkey | |
|---|---|---|---|---|---|
| 0 | Sammanthranapura | Colombo | Colombo | Western | sammanthranapuracolombocolombowestern |
| 1 | Mattakkuliya | Colombo | Colombo | Western | mattakkuliyacolombocolombowestern |
| 2 | Modara | Colombo | Colombo | Western | modaracolombocolombowestern |
| 3 | Madampitiya | Colombo | Colombo | Western | madampitiyacolombocolombowestern |
| 4 | Mahawatta | Colombo | Colombo | Western | mahawattacolombocolombowestern |
| ... | ... | ... | ... | ... | ... |
| 13984 | Demeda | Deraniyagala | Kegalle | Sabaragamuwa | demedaderaniyagalakegallesabaragamuwa |
| 13985 | Kosgahakanda | Deraniyagala | Kegalle | Sabaragamuwa | kosgahakandaderaniyagalakegallesabaragamuwa |
| 13986 | Yatiwala | Deraniyagala | Kegalle | Sabaragamuwa | yatiwaladeraniyagalakegallesabaragamuwa |
| 13987 | Magala | Deraniyagala | Kegalle | Sabaragamuwa | magaladeraniyagalakegallesabaragamuwa |
| 13988 | Dikellakanda | Deraniyagala | Kegalle | Sabaragamuwa | dikellakandaderaniyagalakegallesabaragamuwa |
13989 rows × 5 columns
We still have some duplicates.
duplicate_df = df_processed[df_processed.duplicated('joinkey', keep=False)] \
  .sort_values('joinkey')
duplicate_df[['GN Division', 'DS Division', 'District', 'Province', 'joinkey']].head()
| GN Division | DS Division | District | Province | joinkey | |
|---|---|---|---|---|---|
| 10341 | Ahugoda West | Polgahawela | Kurunegala | North Western | ahugodawestpolgahawelakurunegalanorthwestern |
| 10335 | Ahugoda West | Polgahawela | Kurunegala | North Western | ahugodawestpolgahawelakurunegalanorthwestern |
| 10694 | Aluthwatta | Chilaw | Puttalam | North Western | aluthwattachilawputtalamnorthwestern |
| 10693 | Aluthwatta | Chilaw | Puttalam | North Western | aluthwattachilawputtalamnorthwestern |
| 2781 | Dewahandiya East | Udadumbara | Kandy | Central | dewahandiyaeastudadumbarakandycentral |
Since these refer to the same region, we merge the data for duplicate admin4 regions. While merging the rows, we sum the population counts from each row having the same key.
df_processed.columns
Index(['GN Division', 'DS Division', 'District', 'Province',
       'Total Population', 'Less than 10', '10 ~ 19', '20 ~ 29', '30 ~ 39',
       '40 ~ 49', '50 ~ 59', '60 ~ 69', '70 ~ 79', '80 ~ 89', '90 and above',
       'joinkey'],
      dtype='object')
df_dissolved = df_processed.groupby(['joinkey'],as_index=False).agg({
    'GN Division': 'first',
    'DS Division': 'first',
    'District': 'first',
    'Province': 'first',
    'Total Population': 'sum',
    'Less than 10': 'sum',
    '10 ~ 19': 'sum',
    '20 ~ 29': 'sum',
    '30 ~ 39': 'sum',
    '40 ~ 49': 'sum',
    '50 ~ 59': 'sum',
    '60 ~ 69': 'sum',
    '70 ~ 79': 'sum',
    '80 ~ 89': 'sum',
    '90 and above': 'sum'
})
df_dissolved = df_dissolved[[
    'joinkey', 'Total Population', 'Less than 10',
    '10 ~ 19', '20 ~ 29', '30 ~ 39','40 ~ 49',
    '50 ~ 59', '60 ~ 69', '70 ~ 79', '80 ~ 89',
    '90 and above']]
print('Total Records of original table', len(df))
print('Total Records of processed table', len(df_dissolved))
Total Records of original table 13989
Total Records of processed table 13973
Pre-Process Shapefile#
Our shapefile comes from a different source and thus has a different structure. We need to match each feature with a record from the data table. We process the data to create a similar ‘joinkey’ and remove duplicates.
shapefile_path = os.path.join(data_folder, shapefile + '.shp')
gdf = gpd.read_file(shapefile_path, encoding='utf-8')
gdf.iloc[:, :5]
| Shape_Leng | Shape_Area | ADM4_EN | ADM4_SI | ADM4_TA | |
|---|---|---|---|---|---|
| 0 | 0.019689 | 0.000015 | Sammanthranapura | සම්මන්ත්රණපුර | None |
| 1 | 0.072878 | 0.000177 | Mattakkuliya | මට්ටක්කුලිය | None |
| 2 | 0.052290 | 0.000064 | Modara | මෝදර | None |
| 3 | 0.019201 | 0.000023 | Madampitiya | මාදම්පිටිය | None |
| 4 | 0.033889 | 0.000042 | Mahawatta | මහවත්ත | None |
| ... | ... | ... | ... | ... | ... |
| 14038 | 0.149196 | 0.000260 | Demeda | දෙමැද | None |
| 14039 | 0.143733 | 0.000765 | Kosgahakanda | කොස්ගහකන්ද | None |
| 14040 | 0.122895 | 0.000583 | Yatiwala | යටිවල | None |
| 14041 | 0.246448 | 0.001756 | Magala | මාගල | None |
| 14042 | 0.275330 | 0.002457 | Dikellakanda | දික්ඇල්ලකන්ද | None |
14043 rows × 5 columns
gdf_processed = gdf.copy()
gdf_processed = gdf_processed.rename(columns = {
    'ADM4_EN': 'GN Division',
    'ADM3_EN': 'DS Division',
    'ADM2_EN': 'District',
    'ADM1_EN': 'Province'})

gn_division = gdf_processed['GN Division'].str.lower().str.replace(' ', '')
ds_division = gdf_processed['DS Division'].str.lower().str.replace(' ', '')
district = gdf_processed['District'].str.lower().str.replace(' ', '')
province = gdf_processed['Province'].str.lower().str.replace(' ', '')

gdf_processed['joinkey'] = gn_division + ds_division + district + province
gdf_processed = gdf_processed[
    ['GN Division', 'DS Division', 'District', 'Province', 'joinkey', 'geometry']]
There are some duplicate polygons having the same ‘joinkey’.
duplicate_gdf = gdf_processed[gdf_processed.duplicated('joinkey', keep=False)] \
  .sort_values('joinkey')
duplicate_gdf[['GN Division', 'DS Division', 'District', 'Province', 'joinkey']]
| GN Division | DS Division | District | Province | joinkey | |
|---|---|---|---|---|---|
| 7879 | [unknown] | Eravur Pattu | Batticaloa | Eastern | [unknown]eravurpattubatticaloaeastern |
| 7877 | [unknown] | Eravur Pattu | Batticaloa | Eastern | [unknown]eravurpattubatticaloaeastern |
| 7876 | [unknown] | Eravur Pattu | Batticaloa | Eastern | [unknown]eravurpattubatticaloaeastern |
| 7875 | [unknown] | Eravur Pattu | Batticaloa | Eastern | [unknown]eravurpattubatticaloaeastern |
| 7838 | [unknown] | Eravur Pattu | Batticaloa | Eastern | [unknown]eravurpattubatticaloaeastern |
| ... | ... | ... | ... | ... | ... |
| 2455 | Miriswatta | Walallawita | Kalutara | Western | miriswattawalallawitakalutarawestern |
| 1389 | Sapugasthenna | Attanagalla | Gampaha | Western | sapugasthennaattanagallagampahawestern |
| 1334 | Sapugasthenna | Attanagalla | Gampaha | Western | sapugasthennaattanagallagampahawestern |
| 10612 | Udappuwa | Mundel | Puttalam | North Western | udappuwamundelputtalamnorthwestern |
| 10613 | Udappuwa | Mundel | Puttalam | North Western | udappuwamundelputtalamnorthwestern |
73 rows × 5 columns
fig, ax = plt.subplots(1, 1)
fig.set_size_inches(10,10)

# Plot all features and highlight duplicates
gdf_processed.plot(ax=ax, facecolor='none', edgecolor='#bdbdbd', linewidth=0.2)
duplicate_gdf.plot(
    'joinkey', ax=ax, categorical=True, edgecolor='#ffffff', linewidth=0.5)

# Zoom to a specific region
selected = gdf_processed[gdf_processed['DS Division'] == 'Mundel']
minx, miny, maxx, maxy = selected.total_bounds
ax.set_xlim(minx, maxx)
ax.set_ylim(miny, maxy)

ax.set_axis_off()
ax.set_title('Duplicate Polygons', size = 18)

plt.show()
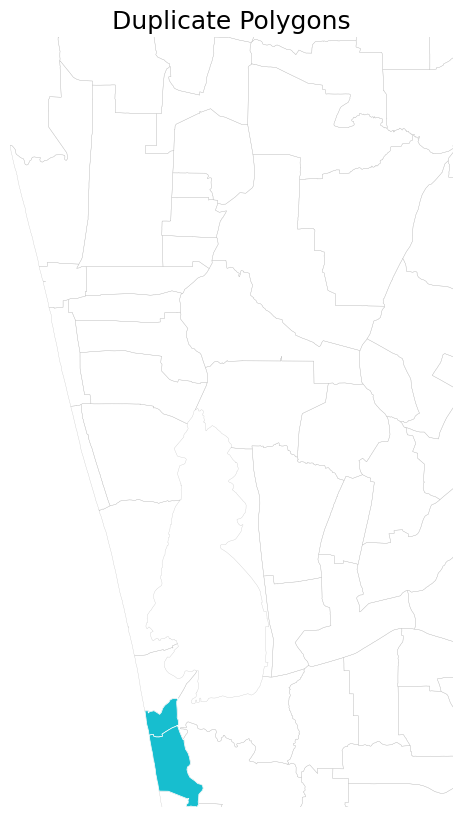
We dissolve (merge) these polygon boundaries to create a single region from multiple polygons having the same attributes.
gdf_dissolved = gdf_processed.dissolve(by='joinkey', aggfunc={
    'GN Division': 'first',
    'DS Division': 'first',
    'District': 'first',
    'Province': 'first'})
gdf_dissolved = gdf_dissolved.reset_index()
print('Total Records of original shapefile', len(gdf))
print('Total Records of processed shapefile', len(gdf_dissolved))
Total Records of original shapefile 14043
Total Records of processed shapefile 13987
Table Join#
Finally, we do a table join using GeoPandas merge().
We have almost equal count of features between the shapefile and table now. There are still a few polygons that do not have corresponding population counts. They will be removed from the output layer.
print('Total Records of processed shapefile', len(gdf_dissolved))
print('Total Records of processed table', len(df_dissolved))
Total Records of processed shapefile 13987
Total Records of processed table 13973
merged = gdf_dissolved.merge(df_dissolved, on='joinkey')
print('Total Records of merged shapefile', len(merged))
Total Records of merged shapefile 10747
There are still many records that do not have an exact match between the shapefile and the population table. This is due to small differences in their spellings. We can instead try a fuzzy match.
Fuzzy Join#
Let’s perform the Fuzzy match. Fuzzy matching for large tables can take long time, so we use tqdm package to track the progress.
gdf_dissolved.rename(columns = {'joinkey':'joinkey_exact'}, inplace=True)
from tqdm import tqdm

def getFuzzyMatch(row):
    joinkey = row['joinkey_exact']
    results = process.extractOne(joinkey, df_dissolved.joinkey)
    match = results[0]
    score = results[1]
    return match, score

tqdm.pandas()
gdf_dissolved[['match', 'score']] = gdf_dissolved.progress_apply(
    getFuzzyMatch, axis=1, result_type='expand')
100%|██████████| 13987/13987 [07:50<00:00, 29.71it/s]
The matches with scores less than 100 are fuzzy matches.
gdf_dissolved[gdf_dissolved['score'] != 100] \
 [['joinkey_exact', 'match', 'score']] \
 .sort_values('score', ascending=False)
| joinkey_exact | match | score | |
|---|---|---|---|
| 0 | 041/2kanuwarajanganayaanuradhapuranorthcentral | 41/2kanuwarajanganayaanuradhapuranorthcentral | 99 |
| 10708 | puthukudiyiruppuwestputhukkudiyiruppumullaitiv... | puthukkudiyiruppuwestputhukkudiyiruppumullaiti... | 99 |
| 3936 | hingurakgodahigurakgodapolonnaruwanorthcentral | hingurakgodahingurakgodapolonnaruwanorthcentral | 99 |
| 3933 | hingurakahigurakgodapolonnaruwanorthcentral | hingurakahingurakgodapolonnaruwanorthcentral | 99 |
| 3932 | hingurakabandaragamahigurakgodapolonnaruwanort... | hingurakabandaragamahingurakgodapolonnaruwanor... | 99 |
| ... | ... | ... | ... |
| 12459 | udumullamadampagamagallesouthern | udumullahikkaduwagallesouthern | 77 |
| 6803 | loinonnorwoodnuwaraeliyacentral | loinonambagamuwanuwaraeliyacentral | 77 |
| 8 | [unknown]ambangangamatalecentral | hunuketeambangangakoralematalecentral | 76 |
| 4473 | injusternorwoodnuwaraeliyacentral | injustryambagamuwanuwaraeliyacentral | 75 |
| 8969 | newvalleygamanorwoodnuwaraeliyacentral | manelwalawalapanenuwaraeliyacentral | 74 |
3236 rows × 3 columns
We can use all matches with a score of above a threshold. You need to use your discretion and local knowledge to determine the appropriate threshold. Here we see all matches with a low score.
score_threshold = 90
gdf_dissolved[gdf_dissolved['score'] < score_threshold] \
  .sort_values('score') \
  [['joinkey_exact', 'match', 'score']]
| joinkey_exact | match | score | |
|---|---|---|---|
| 8969 | newvalleygamanorwoodnuwaraeliyacentral | manelwalawalapanenuwaraeliyacentral | 74 |
| 4473 | injusternorwoodnuwaraeliyacentral | injustryambagamuwanuwaraeliyacentral | 75 |
| 8 | [unknown]ambangangamatalecentral | hunuketeambangangakoralematalecentral | 76 |
| 5527 | kawattikudatown&gravetstrincomaleeeastern | kavaddikkudatrincomaleetownandgravetstrincomal... | 77 |
| 9812 | panmurnorwoodnuwaraeliyacentral | panmurambagamuwanuwaraeliyacentral | 77 |
| ... | ... | ... | ... |
| 13575 | welipathayayakalthotaratnapurasabaragamuwa | welipathayayabalangodaratnapurasabaragamuwa | 89 |
| 20 | [unknown]manmunaisouth&eruvilpattubatticaloaea... | mankadumanmunaisouth&eruvilpattubatticaloaeastern | 89 |
| 5853 | kirimichchaikoralaipattunorthbatticaloaeastern | kirimichaikoralaipattunorth(vaharai)batticaloa... | 89 |
| 5131 | kankeyanodaisouthmanmunaipattubatticaloaeastern | kankeyanodaisouthmanmunaipattu(araipattai)batt... | 89 |
| 8715 | narangamuwalaggalamatalecentral | narangamuwamatalematalecentral | 89 |
550 rows × 3 columns
Save the high score matches as joinkey.
gdf_dissolved['joinkey'] = np.where(
    gdf_dissolved['score'] >= 90,
    gdf_dissolved['match'],
    '')
Use the new joinkey which contains the fuzzy matches from the df_dissolved table. Now we will get a lot more matches of records.
merged = gdf_dissolved.merge(df_dissolved, on='joinkey')
print('Total Records of merged shapefile', len(merged))
Total Records of merged shapefile 13437
Save the datasets#
output_dir = 'output'
output_filename = 'srilanka.gpkg'
output_path = os.path.join(output_dir, output_filename)

gdf_dissolved.to_file(driver='GPKG', filename=output_path, layer='admin4polygons', encoding='utf-8')
merged.to_file(driver='GPKG', filename=output_path, layer='merged', encoding='utf-8')

print('Successfully written output file at {}'.format(output_path))
Successfully written output file at output/srilanka.gpkg
If you want to give feedback or share your experience with this tutorial, please comment below. (requires GitHub account)