Locating Nearest Facility with OpenRouteService Time-Distance Matrix API#
Introduction#
Openrouteservice provides a free API service for many common network analysis tasks using the OpenStreetMap database. Openrouteservice’s Time-Distance Matrix service allows you to obtain time and distance information between many pairs of origins and destinations along a road network using the specified mode of transport. This service can compute upto 3500 location pairs in a single request, so it is very efficient compared to calculating the route between each pair one by one. This tutorial also shows you how to use the requests module to configure and send HTTP POST requests.
Overview of the Task#
We will take 2 layers for Washington DC - one with points representing addresses and another with points representing mental health facilities - and find out the facility with the least travel distance from each address using the OpenRouteService (ORS) Matrix API.
Input Layers:
Address_Points.zip: A shapefile with locations of randomly selected 100 addresses.Adult_Mental_Health_Providers.zip: A shapefile with locations of Adult Mental Health Providers
Output:
matrix.gpkg: A GeoPackage containing the name and coordinates of the nearest health facility for each address.
Data Credit
District of Columbia Open Data Catalog. Accessed: August 2019
Running the Notebook:
The preferred way to run this notebook is on Google Colab.
![]()
Watch Video Walkthrough: Watch a detailed explanation of the workflow. YouTube
Setup and Data Download#
The following blocks of code will install the required packages and download the datasets to your Colab environment.
%%capture
if 'google.colab' in str(get_ipython()):
    !pip install contextily
import os
import requests
import pandas as pd
import geopandas as gpd
import matplotlib.pyplot as plt
import contextily as cx
from shapely.geometry import Point, LineString
data_folder = 'data'
output_folder = 'output'

if not os.path.exists(data_folder):
    os.mkdir(data_folder)
if not os.path.exists(output_folder):
    os.mkdir(output_folder)
def download(url):
    filename = os.path.join(data_folder, os.path.basename(url))
    if not os.path.exists(filename):
        from urllib.request import urlretrieve
        local, _ = urlretrieve(url, filename)
        print('Downloaded ' + local)

download('https://github.com/spatialthoughts/python-tutorials/raw/main/data/' +
         'Address_Points.zip')
download('https://github.com/spatialthoughts/python-tutorials/raw/main/data/' +
         'Adult_Mental_Health_Providers.zip')
Visit OpenRouteService Sign-up page and create an account. Once your account is activated, visit your Dashboard and request a token. Select Standard as the Token type and enter python as the Token name. Click CREATE TOKEN. Once created, copy the long string displayed under Key and enter below.
ORS_API_KEY = 'replace this with your key'
Procedure#
Read the Adult_Mental_Health_Providers.zip file and convert it to a GeoDataFrame.
health_shp = 'Adult_Mental_Health_Providers.zip'
health_shp_path = os.path.join(data_folder, health_shp)
health_gdf = gpd.read_file(health_shp_path)
health_gdf
Read the Address_Points.zip file and convert it to a GeoDataFrame.
address_shp = 'Address_Points.zip'
adddress_shp_path = os.path.join(data_folder, address_shp)
address_gdf = gpd.read_file(adddress_shp_path)
address_gdf
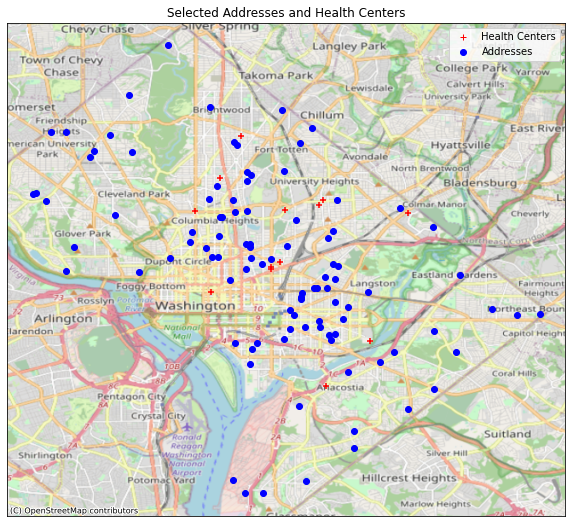
Let’s visualize the locations.
fig, ax = plt.subplots(1, 1)
fig.set_size_inches(10,10)
address_gdf.plot(ax=ax, color='blue', alpha=1, marker='o')
health_gdf.plot(ax=ax, color='red', alpha=1, marker='+')
cx.add_basemap(ax, crs=health_gdf.crs, source=cx.providers.OpenStreetMap.Mapnik)

legend_elements = [
    plt.plot([],[], color='red', alpha=1, marker='+', label='Health Centers', ls='')[0],
    plt.plot([],[], color='blue', alpha=1, marker='o', label='Addresses', ls='')[0]]
ax.legend(handles=legend_elements, loc='upper right')
ax.get_xaxis().set_visible(False)
ax.get_yaxis().set_visible(False)
ax.set_title('Selected Addresses and Health Centers')

plt.show()
To standardize the workflow, we rename the dataframes to appropriate names and select the attribute containing the names we want in the output. You should change it to match your datasets.
origin_gdf = address_gdf
origin_name_column = 'OBJECTID_1'
destination_gdf = health_gdf
destination_name_column = 'NAME'
The ORS Time-Distance Matrix API needs a list of locations in the (longitude,latitude) format. We take the geometry column from the GeoDataFrame and create the list.
origins = list(zip(origin_gdf.geometry.x, origin_gdf.geometry.y))
destinations = list(zip(destination_gdf.geometry.x, destination_gdf.geometry.y))
locations = origins + destinations
Another parameter required by the API are the list of indices for origins and destinations. If you want the distances between each location, you can specify all instead of the list of indices.
origins_index = list(range(0, len(origins)))
destinations_index = list(range(len(origins), len(locations)))
body = {'locations': locations,
       'destinations': destinations_index,
       'sources': origins_index,
       'metrics': ['distance']}

headers = {
    'Accept': 'application/json, application/geo+json, application/gpx+xml, img/png; charset=utf-8',
    'Authorization': ORS_API_KEY,
    'Content-Type': 'application/json; charset=utf-8'
}

response = requests.post('https://api.openrouteservice.org/v2/matrix/driving-car', json=body, headers=headers)
distances = response.json()['distances']
distances
The response contains the list of distances from each origin to each destination. We iterate over each origin and extract the minimum distance and the destination coordinate. We reverse lookup the coordinate from the destination dataframe and extract the name of the destination.
distance_matrix = []
for origin_index, item  in origin_gdf.iterrows():
  origin_name = item[origin_name_column]
  origin_x = item.geometry.x
  origin_y = item.geometry.y
  origin_distances = distances[origin_index]
  # We find the minimum distance and the index of the minimum distance
  min_distance = min(origin_distances)
  min_index = origin_distances.index(min_distance)
  destination_index = destinations_index[min_index]
  destination_x, destination_y = locations[destination_index]
  filtered = health_gdf[(destination_gdf.geometry.x == destination_x) & (destination_gdf.geometry.y == destination_y) ]
  destination_row = filtered.iloc[0]
  destination_name = destination_row[destination_name_column]

  distance_matrix.append(
    [origin_name, origin_y, origin_x, destination_name, destination_y, destination_x, min_distance])
Now we are a list of items. We create a Pandas DataFrame from it.
matrix_df = pd.DataFrame(distance_matrix,
                  columns =['origin_name', 'origin_y', 'origin_x', 'destination_name', 'destination_y', 'destination_x', 'distance'])
matrix_df
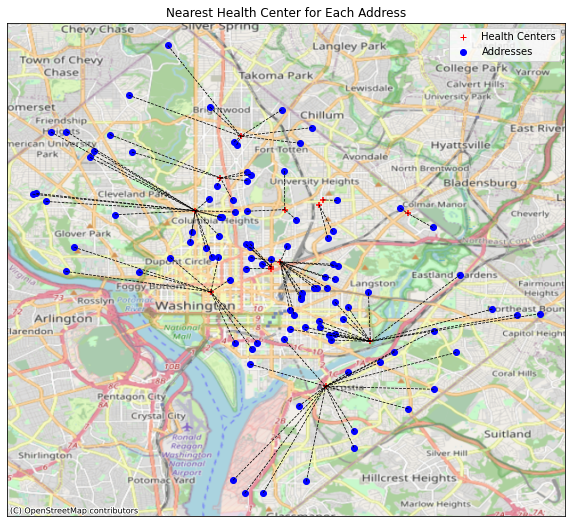
To visualize and validate the results, let’s create a line connecting the origin and destination that we can plot on a map.
def create_line(row):
  origin_point = Point(row['origin_x'], row['origin_y'])
  destination_point = Point(row['destination_x'], row['destination_y'])
  return LineString([origin_point, destination_point])

geometry = matrix_df.apply(create_line, axis=1)

matrix_gdf = gpd.GeoDataFrame(matrix_df, geometry=geometry, crs='EPSG:4326')
matrix_gdf
Visualize the results
fig, ax = plt.subplots(1, 1)
fig.set_size_inches(10,10)
address_gdf.plot(ax=ax, color='blue', alpha=1, marker='o')
matrix_gdf.plot(ax=ax, color='black', linestyle='--', linewidth=0.75)
health_gdf.plot(ax=ax, color='red', alpha=1, marker='+')

cx.add_basemap(ax, crs=health_gdf.crs, source=cx.providers.OpenStreetMap.Mapnik)

legend_elements = [
    plt.plot([],[], color='red', alpha=1, marker='+', label='Health Centers', ls='')[0],
    plt.plot([],[], color='blue', alpha=1, marker='o', label='Addresses', ls='')[0]]
ax.legend(handles=legend_elements, loc='upper right')
ax.get_xaxis().set_visible(False)
ax.get_yaxis().set_visible(False)
ax.set_title('Nearest Health Center for Each Address')
plt.show()
Save the results.
output_file = 'matrix.gpkg'
output_path = os.path.join(output_folder, output_file)

origin_gdf.to_file(driver='GPKG', filename=output_path, layer='origins')
destination_gdf.to_file(driver='GPKG', filename=output_path, layer='destinations')
matrix_gdf.to_file(driver='GPKG', filename=output_path, layer='distance_matrix')
If you want to give feedback or share your experience with this tutorial, please comment below. (requires GitHub account)